
Breaking Down Google Analytics Data and What It Means
Google Analytics provides powerful insights about your website’s users. But understanding isn’t all that straightforward for beginners, and that’s why we’re here! Let’s talk about what Google Analytics is, what it does, and what all wonderful reports it can tell you about your website visitors.
What is Google Analytics
Google Analytics is a free tracking tool offered by Google, and it provides insight into the visitors who come to your website. You are capable of seeing the number of visitors on your site in real time, where they are coming from, and even which device they are accessing your site on, and so much more.
What Does Google Analytics Do?
Google Analytics offers its users information about the online behavior of their audience, which can be critical for your business. There are many reasons why you should be utilizing this free tool. It has many benefits, including:
Measures your website’s performance
Check if your marketing efforts are working
Which type of content should you create, or products should you list on your website
Divide your audience into segments based on age, gender, country, device, etc.
Optimize your web pages to boost conversions
Using the Reports
Once you have set up your account and added your tracking code, it’s time for the fun and to see exactly what Google Analytics can do for you.
The first thing you’ll see is the Google Analytics home screen. This will give you a quick overview of how your website is performing.
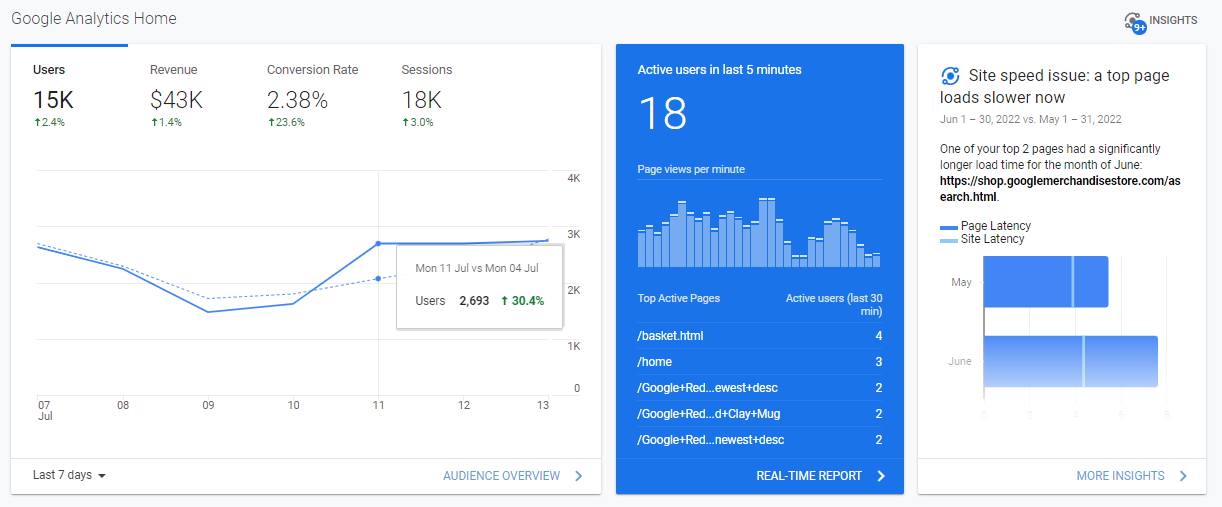
In the above screen grab of the home screen, you’ll notice:
Users: how many visitors came to your website (in the past 7 days, in this example)
Sessions: how many interactions a visitor makes within your website within a period. Ex: viewing a page, clicking a link, or purchasing a product.
Bounce Rate: how many visitors hit the back button or close your website without performing an interaction.
Session Duration: the average amount of time a visitor spends on the website
Active Users Right Now: How many active users do you currently have on your website
Connect With Us
Categories
Recent Posts
Archives
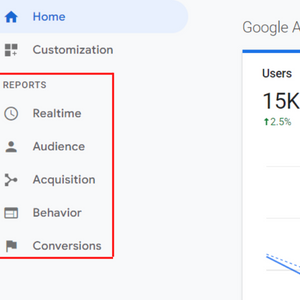
Left Column Google Analytics Reports
On the left side of the dashboard, you’ll find various reports. Each of these reports will provide insight into how a user interacts and behaves with your website.
The Realtime Report
This report will show you the number of users currently on your site. This is the tab you go to when you want to see real-time activity on your website.
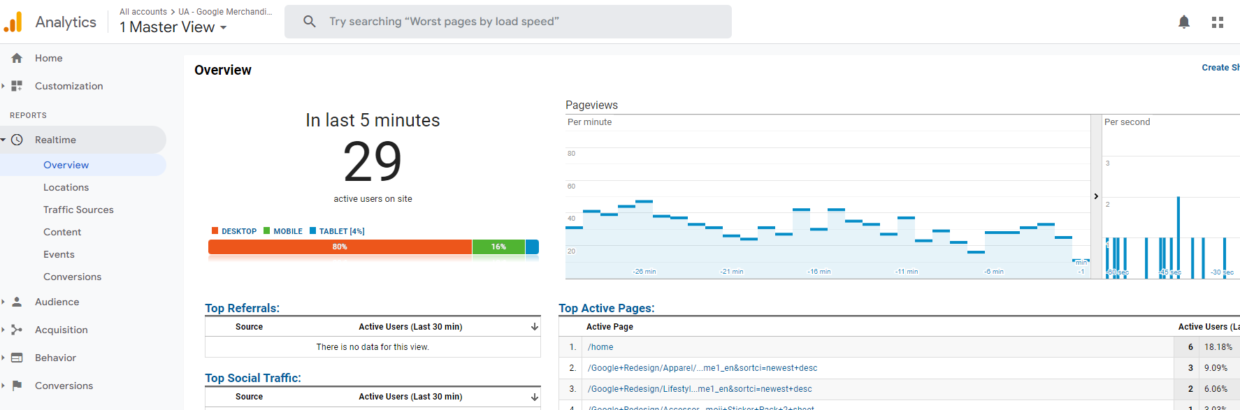
By clicking Overview, you can see the top active pages on your website, how many visitors are on each page, and the country they are from. The overview will show all the important information in one place. But you can also use the more options like traffic source, content, event, and location to get more insight about your real-time performance.
These reports are great for measuring the performance of recent campaigns that you are running.
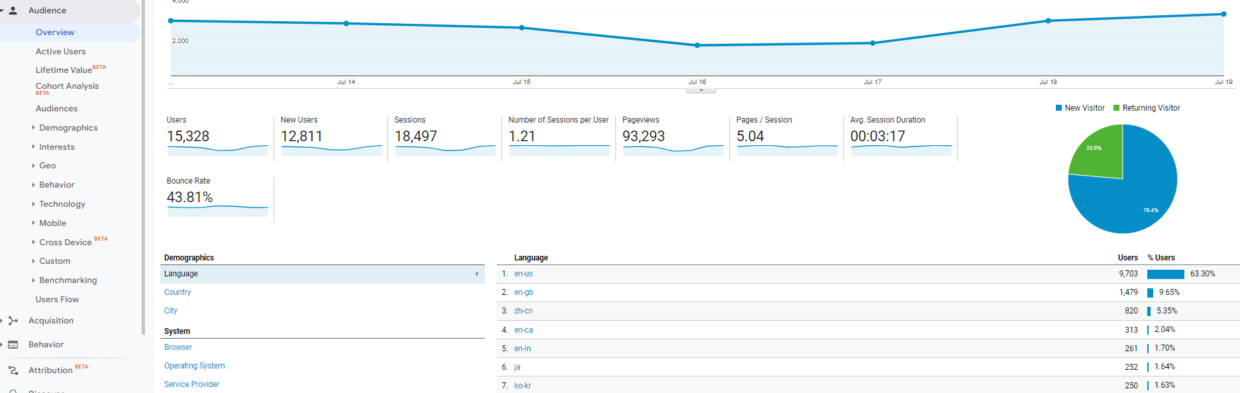
The Audience Report
This report in Google Analytics breaks down your website traffic. If you are interested in knowing the age of your visitors or the device they are using, this is where you would go. As you can see under Audience, more reports are easy to understand. You can gain better insight into demographics, geography, interests, etc. The mobile section will show you which device your visitors are using to view your website. This can be helpful information when deciding which pages to optimize.
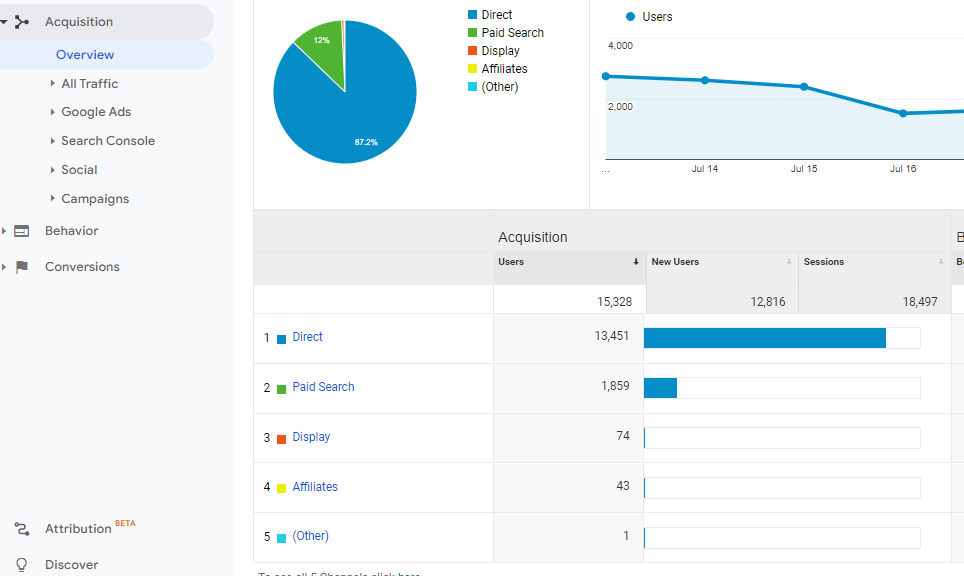
The Acquisition Report
First, starting with Google Analytics, the acquisition report will be very helpful. It will show you how the traffic reaches your website. Google Analytics divides these traffic sources into four categories:
Organic Search: users who come from search engines like Google or Bing
Direct: users who directly type your website into the browser, open your website through a bookmark, or when Google can’t recognize the traffic source.
Referral: users that come from any source other than search engines, like a link on another website or a YouTube video.
Social: users that arrive on your website from a social media platform like Facebook or Instagram.
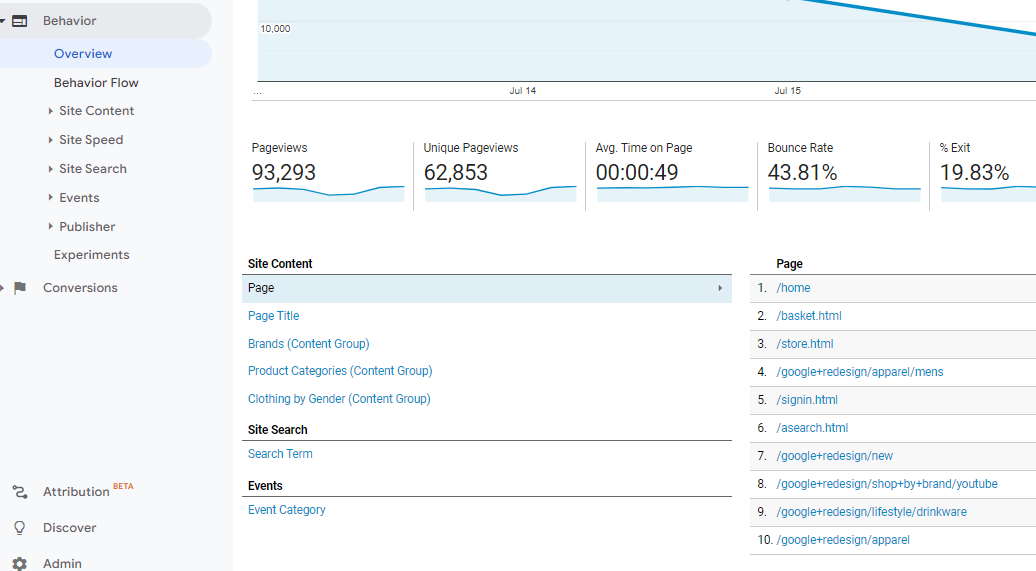
The Behavior Report
If you are interested in finding out what your users are doing on your website, this is the report you would go to. In its Overview, it will show you a snapshot of your user’s behavior:
Pageviews: the total number of pages viewed by your visitors
Unique Pageviews: This is when an individual has viewed a certain page at least once
Average Time on a Page: It’s the average amount of time a visitor spends on your website
Bounce Rate: the percentage of visitors who only view one page and then leave without interacting with it
Percentage Exit: How often visitors exit your website’s pages
The Conversion Report
Lastly, the conversion report tells you how your website’s conversion rate is performing.
What is a conversion rate? It is simply any activity completed by a visitor.
This report can get a little confusing for beginners. It requires advanced setups like creating a goal in Google Analytics or setting up eCommerce tracking. To understand how this works, here’s an overview of two reports that might be useful to you: Goals and Ecommerce.
Under Goals, you can go to Overview and see the total goal completions on your website, like visitors placing a bid. It will also show you the location where your goals are completed the most.
If you are running an online store, then the eCommerce section is important for you. It will provide you with individual product performance, sales performance, order size, and time of purchase. All of these metrics should be important to you to help improve your online sales and boost conversions.
Since there is additional setup for the conversion report, there’s an easier way to collect this data. You can simply install a WordPress plugin called MonsterInsights that will allow you to track your store’s performance without the manual setup.
MonsterInsights Reports- a Quick Overview
The MonsterInsights plugin is one of the most user-friendly Google Analytics plugins for WordPress. It enables anyone to install and use Google Analytics in WordPress easily, without any daunting code. MonterInsights offers a variety of reports that make reading Google Analytics very easy.
All of these metrics are useful to learn more about your users and to help improve your marketing strategies, SEO, and boost your conversions. Now you are ready to make a Google Analytics account, if you don’t already have one, and start leveraging the information to improve your own marketing strategy!
If you are looking for some help with your current marketing needs, feel free to reach out to the Spectrum Net Designs Team! We’d be happy to see if there’s an opportunity to get more out of your current strategy!